
What is lactic acid?
Lactic acid is a byproduct of anaerobic respiration - the process by which cells generate energy (in the form of ATP) in the absence of oxygen.
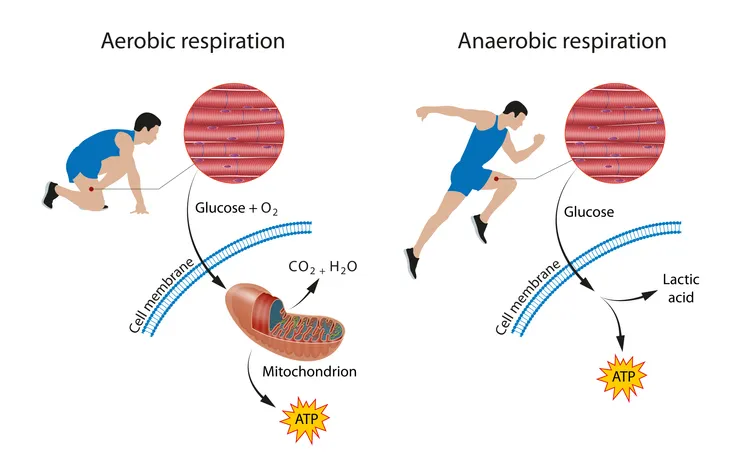
Our skeletal muscles, in particular fast-twitch glycolytic (Type IIx) muscle fibres, are the main producers of lactic acid in the body.
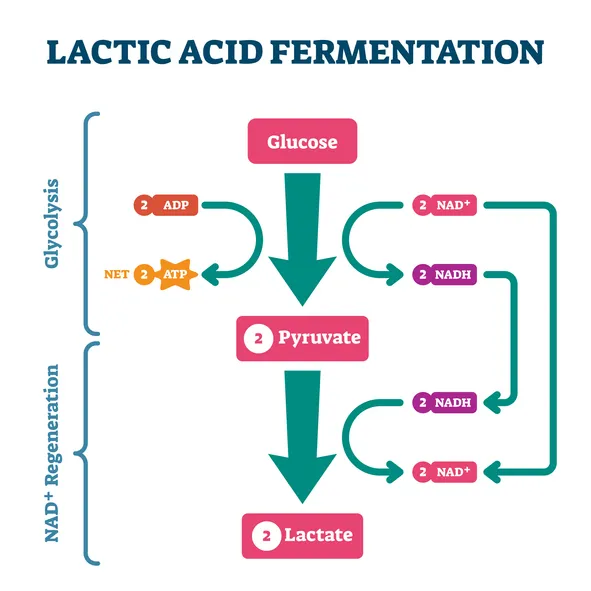
During intense, anaerobic exercise such as sprinting or powerlifting, our Type IIx fibres break down glucose for energy through a process called glycolysis. This generates a molecule pyruvate, which is then converted by an enzyme called lactate dehydrogenase (LDH) into lactic acid (lactate).
What is lactate?
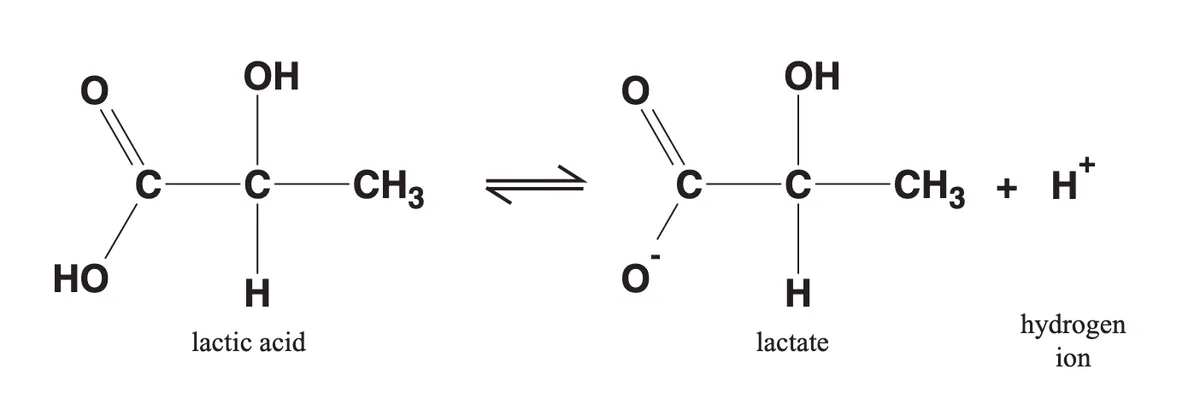
As you may recall from high school chemistry lessons, strong acids quickly dissociate in watery solutions into hydrogen ions (H+) and anions. It is this generation of H+ ions, which lowers pH, that makes a molecule an acid.
In the same way, a molecule of lactic acid produced in the body quickly dissociates, yielding lactate (an anion) and a hydrogen ion (H+). For this reason, the terms ‘lactic acid’ and ‘lactate’ are often used interchangeably.
Source: Phypers, B., & Pierce, J. T. (2006). Lactate physiology in health and disease. Continuing Education in Anaesthesia, Critical Care and Pain, 6(3), 128-132.
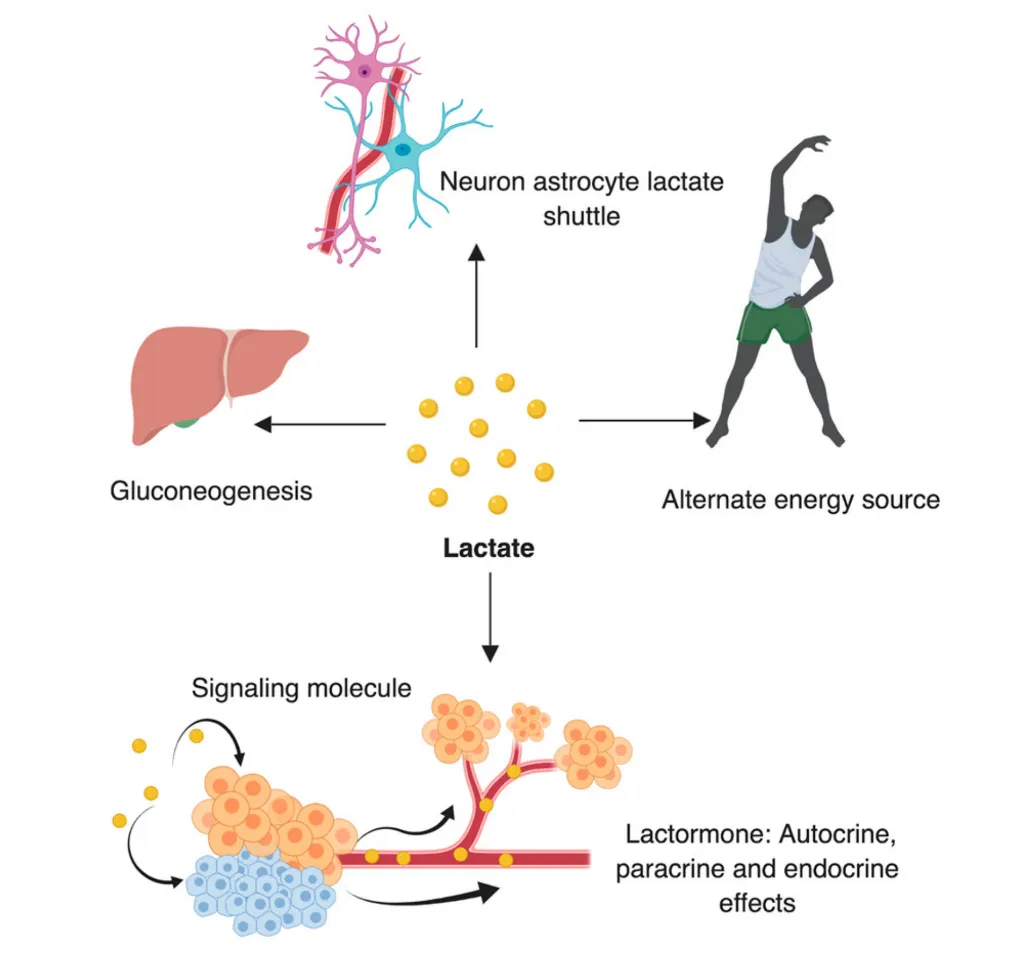
Rather than being merely a waste product of anaerobic respiration (glycolysis), lactate can act as a fuel source for muscles, in particular slow-twitch oxidative (Type I) fibres. More specifically, lactate can be converted back into pyruvate, which is then used in aerobic respiration (using oxygen) to generate chemical energy in the form of ATP. Lactate is therefore a useful fuel source for skeletal and heart muscle during endurance activities that rely heavily on aerobic respiration (e.g. long-distance running).
In addition to muscle, the liver can also take up lactate and convert it into glucose. This process is known as gluconeogenesis. Glucose produced by the liver from lactate can then be reused by muscles for energy in a cycle called the Cori cycle.
Source: Mishra, D., & Banerjee, D. (2019). Lactate dehydrogenases as metabolic links between tumor and stroma in the tumor microenvironment. Cancers, 11(6), 750.
As well as these roles in energy production, lactate may also act as a signalling molecule or hormone. For example, lactate in the bloodstream can signal to muscle cells to grow and start producing more proteins - in other words lactate can stimulate muscle protein synthesis and hypertrophy (an increase in muscle size).
It does this by increasing the expression of various genes (e.g. mTOR, IGF-1) that promote growth. These signalling / hormonal properties of lactate have earned it the moniker “lactormone”.
Does lactic acid / lactate cause muscle fatigue and soreness?
Lactic acid and lactate have been historically maligned as the cause of muscle fatigue and burning sensations (i.e. “the burn”) during exercise, as well as muscle soreness following exercise. We now know this isn’t strictly true.
During intense, anaerobic exercise, production of lactic acid by fast-twitch, glycolytic muscle fibres rises. As explained in the previous section, lactic acid quickly dissociates to yield lactate and hydrogen (H+) ions.
If allowed to accumulate, H+ ions start to lower the pH of the immediate environment of muscle cells. It is this acidic environment due to the build-up of H+ ions, rather than lactate per se, that is one cause of muscle fatigue and burning sensations during intense exercise. Nevertheless, concentrations of lactate in the bloodstream can be a useful proxy of H+ ions generated during exercise. In this respect, higher blood lactate concentrations may reflect increased generation or poorer clearance of H+ ions from the bloodstream, which can increase the risk of muscle fatigue (we will go into further detail on this in later sections).
Soreness following exercise (known as Delayed Onset Muscle Soreness (DOMS)) is not due to the accumulation of lactic acid / lactate, but rather due to inflammation following microscopic tears to muscle fibres.
How is lactate cleared from the bloodstream?
Our muscle cells have specialised transporter proteins, known as monocarboyxlate transporters (MCTs), which move lactate and hydrogen (H+) ions together across their cell membranes.
By helping to remove hydrogen ions (along with lactate) from the bloodstream, MCTs ensure the immediate environment of muscle cells does not become too acidic, thereby helping to prevent muscle fatigue.
MCTs also allow lactate to be taken up from the bloodstream into muscles and be re-used for energy. Similarly, MCTs enable liver cells to take up lactate and convert it into glucose, which can then be released into the bloodstream and used by muscles for energy.
This process of moving lactate between different muscle cells, the liver, and the bloodstream is known as cell-cell lactate shuttling.
Let’s take a deeper look at lactate shuttling in the body.
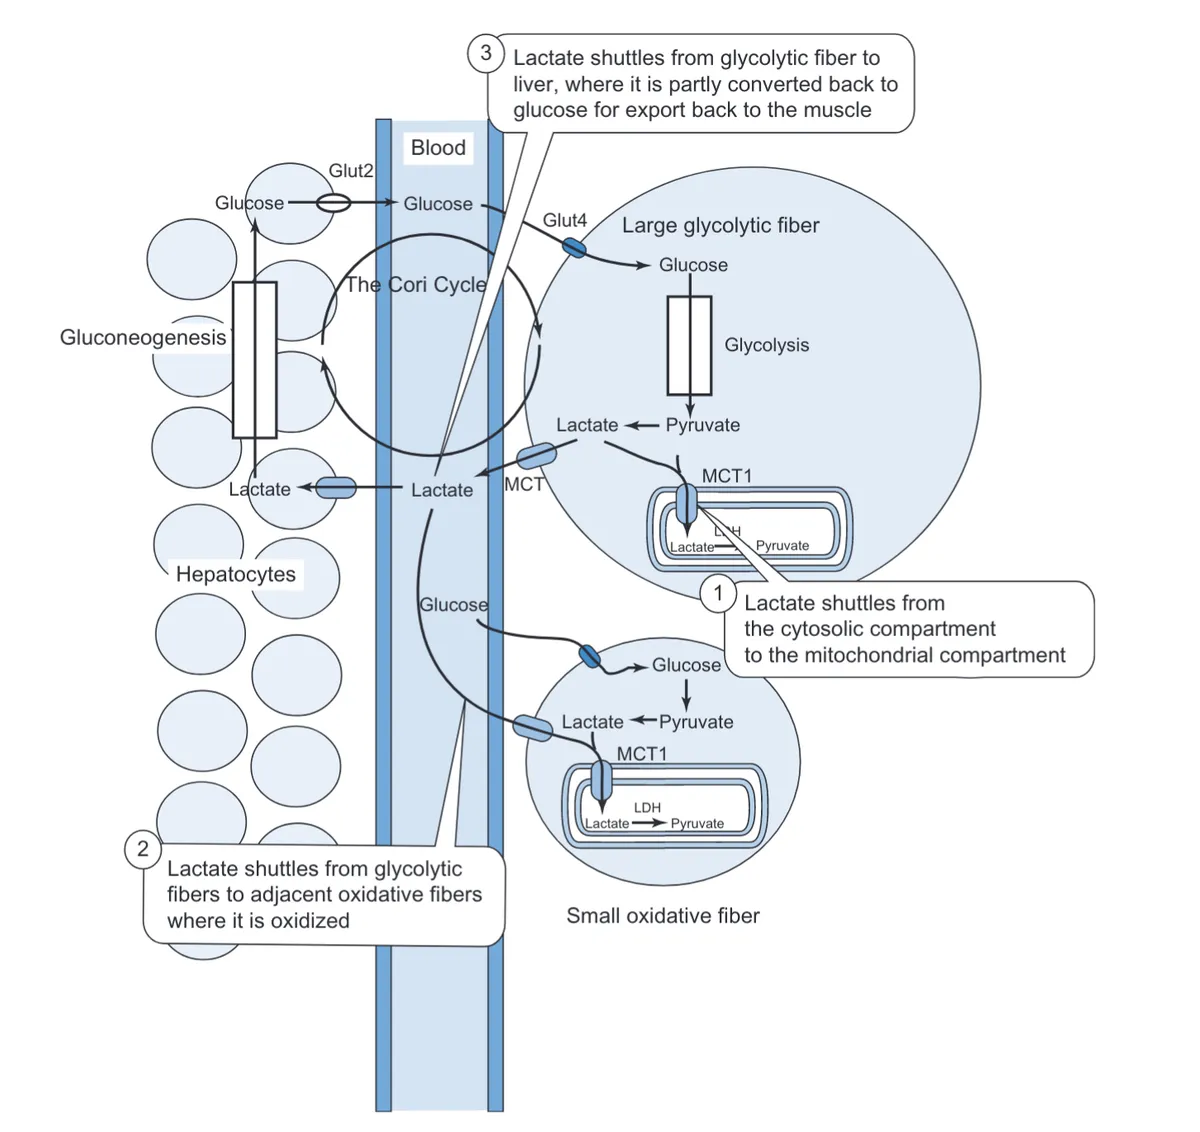
Source: Feher, Joseph. (2012). Muscle Energetics, Fatigue, and Training. 10.1016/B978-0-12-382163-8.00030-X.
As described in the previous section, lactate and H+ ions are generated by anaerobic respiration in fast-twitch, glycolytic (Type IIx) muscle fibres. More specifically, through a process of glycolysis, glucose is broken down for energy into pyruvate, which is then converted into lactate and H+ ions.
If hydrogen ions (along with lactate) were allowed to accumulate in these fast-twitch muscle cells, they would soon lower the pH inside the cell, disrupting the function of various enzymes that allow the cell to survive.
To combat this, fast-twitch, glycolytic muscle fibres have a particular type of MCT transporter protein, MCT4, which pumps out lactate and hydrogen ions into the bloodstream.
Of course, if hydrogen ions and lactate were now allowed to accumulate in the bloodstream, they would again lower the pH of blood, perturbing the environment of muscle cells and other tissue, leading to muscle fatigue.
Our slow-twitch, oxidative (Type I) muscle fibres, however, have another type of MCT protein, called MCT1, which transports hydrogen ions and lactate from the bloodstream into muscle cells. The clearance of hydrogen ions (alongside lactate) by MCT1 therefore helps to regulate the pH of the immediate environment of muscle cells, preventing it from becoming too acidic and causing muscle fatigue.
Furthermore, MCT1 enables slow-twitch, oxidative Type I muscle fibres to re-use lactate for energy. Lactate can be taken up from the bloodstream by MCT1 and then converted into pyruvate. In turn, pyruvate can then be used in the process of aerobic respiration (specifically the citric acid cycle (TCA) stage of aerobic respiration) to generate ATP, which can be used to power muscle contractions. In this respect, MCT1 plays a key role in the recycling of lactate for energy during endurance exercise.
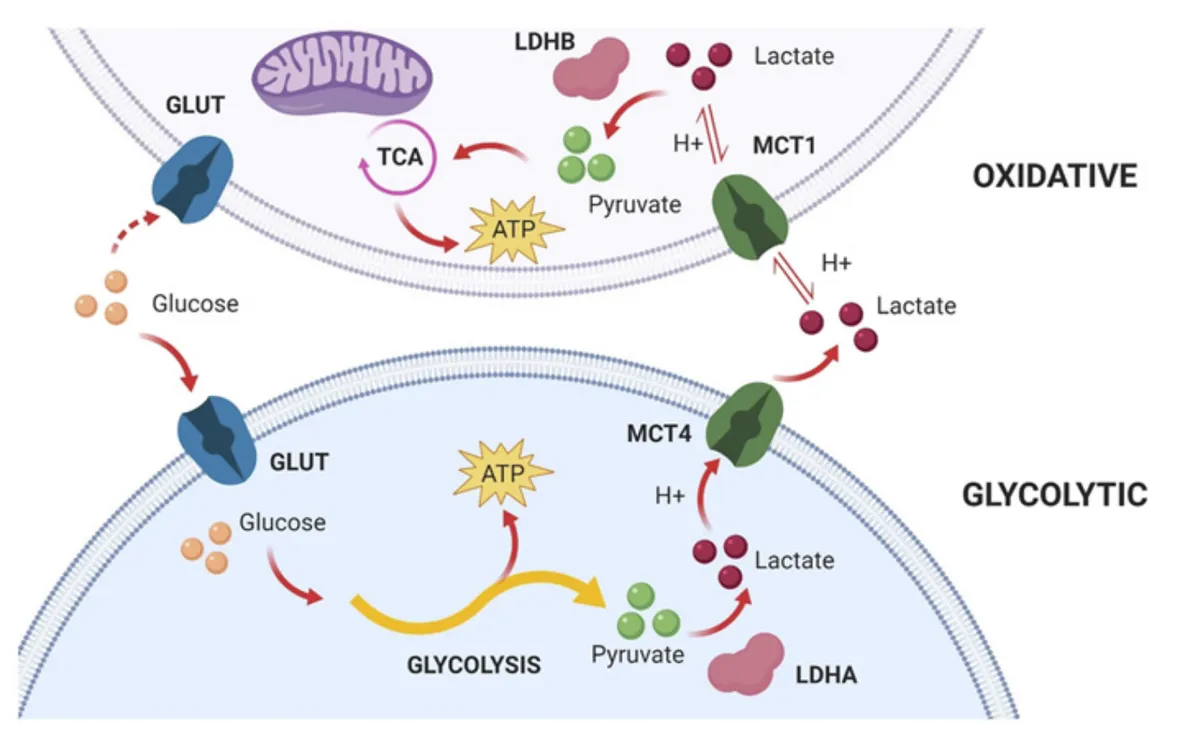
Source: Felmlee, M. A., Jones, R. S., Rodriguez-Cruz, V., Follman, K. E., & Morris, M. E. (2020). Monocarboxylate transporters (SLC16): function, regulation, and role in health and disease. Pharmacological reviews, 72(2), 466-485.
As alluded to earlier, MCT1 also allows liver cells (hepatocytes) to take up lactate from the bloodstream and convert it into glucose by a process of gluconeogenesis. Newly produced glucose can then be released back into the bloodstream and taken up by fast-twitch, glycolytic muscle fibres for energy as part of the Cori cycle.
How does the rate of lactate clearance affect muscle fatigue?
We’ve established that it is the accumulation of H+ ions alongside lactate in the bloodstream that contributes to muscle fatigue during intense exercise.
In very simplistic terms, the rate at which hydrogen ions and lactate accumulate in the bloodstream is a function of two basic processes:
- The rate at which lactate and hydrogen ions are generated and released into the bloodstream by muscle fibres during anaerobic respiration.
- The rate at which lactate and hydrogen ions are cleared from the bloodstream by slow-twitch oxidative muscle fibres, liver, and other tissue.
For a given intensity of exercise, people who clear lactate and hydrogen ions at a faster rate will accumulate hydrogen ions and lactate in their bloodstream less quickly. They will therefore be less likely to experience muscle fatigue and can tolerate a higher intensity of exercise before fatigue occurs.
On this note, you may have heard of the concept of lactate threshold. This is the intensity of exercise at which levels of lactate start to rise in the bloodstream, as the rate of lactate generation exceeds the rate of lactate clearance.
Endurance and high-intensity exercise training acts to elevate lactate threshold - in other words, it allows people to tolerate a greater intensity of exercise before blood lactate levels start to rise and fatigue sets in.
This effect is illustrated in the bottom two curves of the graph below, with the solid black post-training curve showing that trained individuals can sustain a higher running speed before blood lactate levels start to rise.
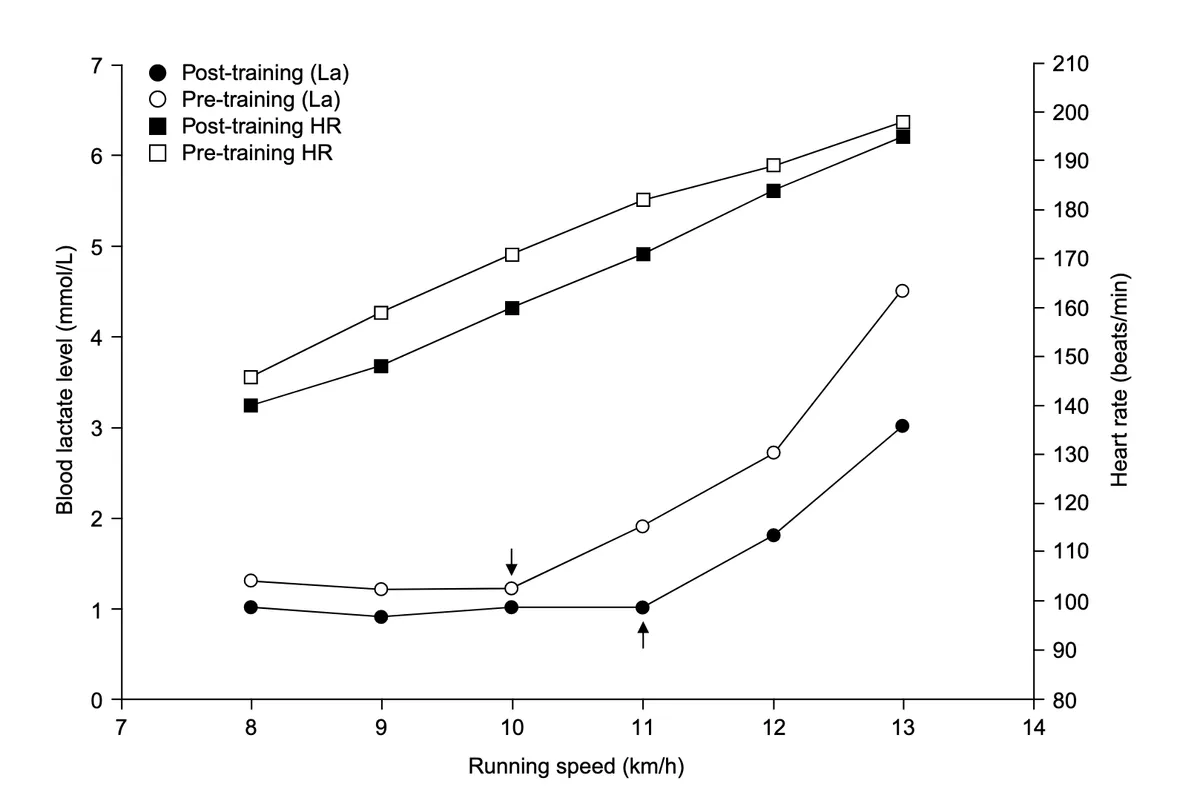
Source: Jones, A. M., & Carter, H. (2000). The effect of endurance training on parameters of aerobic fitness. Sports medicine, 29(6), 373-386.
Studies suggest that this shift in lactate threshold following exercise training is largely due to increases in lactate clearance. Put simply, people who undergo exercise training get better at clearing lactate and hydrogen ions from their bloodstream, thereby preventing the accumulation of hydrogen ions during intense exercise. This allows trained individuals to withstand higher intensities of exercise before experiencing muscle fatigue and enables less recovery time between exercise bouts.
The enhancement in lactate clearance following exercise is likely due to the increased expression of MCT1 proteins by muscle cells, which enables greater clearance of lactate and hydrogen ions from the bloodstream. On this note, studies demonstrate that endurance, sprint, and resistance training can increase MCT1 content of skeletal muscle by between 18 and 90%.
What is the MCT1 gene?
As explained in the ‘How is lactate cleared from the bloodstream?’ section above, MCT1 (monocarboxylate transporter 1) is a type of transporter protein that moves lactate and hydrogen ions from the bloodstream to inside cells, including slow-twitch, oxidative (Type I) muscle fibre cells and liver cells.
The MCT1 protein is coded for by the MCT1 gene (also known as the SLC16A1 gene). Variants of this gene may affect the expression of the MCT1 protein by skeletal muscle. This, in turn, can alter the rate of lactate clearance, susceptibility to muscle fatigue, and recovery times between exercise bouts.
What MCT1 gene variants do you look at?
Your Lactate clearance and building muscle (MCT1) trait looks at variants of the MCT1 gene created by the rs1049434 SNP (Single Nucleotide Polymorphism).
This SNP causes a T > A change in the DNA code of the MCT1 gene, giving rise to a change in the amino acid sequence of the MCT1 protein at position 490 from glutamine (Glu) to aspartate (Asp).
The SNP therefore creates two different MCT1 gene variants or ‘alleles’:
- Asp (A) allele
- Glu (T) allele
(Note that the nomenclature of these different alleles may vary in the literature).
The Asp (A) variant of the MCT1 gene has been linked to less effective lactate clearance. One study suggested that the Asp (A) variant caused a 60-65% reduction in lactate clearance, although the impact of this gene variant is likely to be lower than this.
How do MCT1 gene variants affect lactate clearance during resistance exercise?
As mentioned in the previous section, the Asp (A) variant (rs1049434) of the MCT1 gene is linked to reduced clearance of lactate from the bloodstream. We might therefore expect carriers of the Asp (A) variant, all other things being equal, to have higher blood lactate levels during resistance exercise.
To flesh out this theory: this is because, during resistance exercise (such as lifting weights), fast-twitch, glycolytic (Type IIx) fibres produce lactate and hydrogen ions during anaerobic respiration, which are released into the bloodstream. Asp (A) variant carriers may then less effectively remove these lactate and hydrogen ions from the bloodstream into slow-twitch muscle fibres, liver cells, and other tissue, therefore resulting in higher blood lactate (and hydrogen ion) concentrations.
Some small studies do seem to accord with this theory. For example, in a 2012 study by Cupeiro and colleagues, 14 women and 15 men all had blood lactate measurements taken during various resistance training circuits using free weights, weight machines, and a combined protocol involving alternating treadmill running and free weights. The circuits typically required subjects to perform 15 reps at 70% of 15RM with 2:1 s cadence for the concentric and eccentric phases respectively (45 s per exercise).
As can be shown in the graphs below, compared to men not carrying the Asp (A) variant (i.e. the TT or Glu/Glu genotype), men with two copies of the Asp (A) variant (i.e. the AA genotype) had significantly higher average and maximal blood lactate levels during the free weight and combined protocols. The Asp/Asp (AA) group also had higher maximal and average lactate levels during the weight machine protocol, although this only reached borderline statistical significance (p = 0.07) for average lactate levels.
Furthermore, men with one copy of the Asp (A) variant (i.e. the TA or Glu/Asp genotype) had significantly higher maximal and average lactate levels during the free weight and combined protocols compared to non-carriers (TT genotype), but their blood lactate levels were generally lower compared to those with two copies of the Asp(A) variant (Asp/Asp or AA genotype). This tentatively suggests an additive effect of the ‘Asp’ variant - carrying two copies of the Asp (A) variant may have more of a detrimental impact on lactate clearance compared to carrying just one copy.
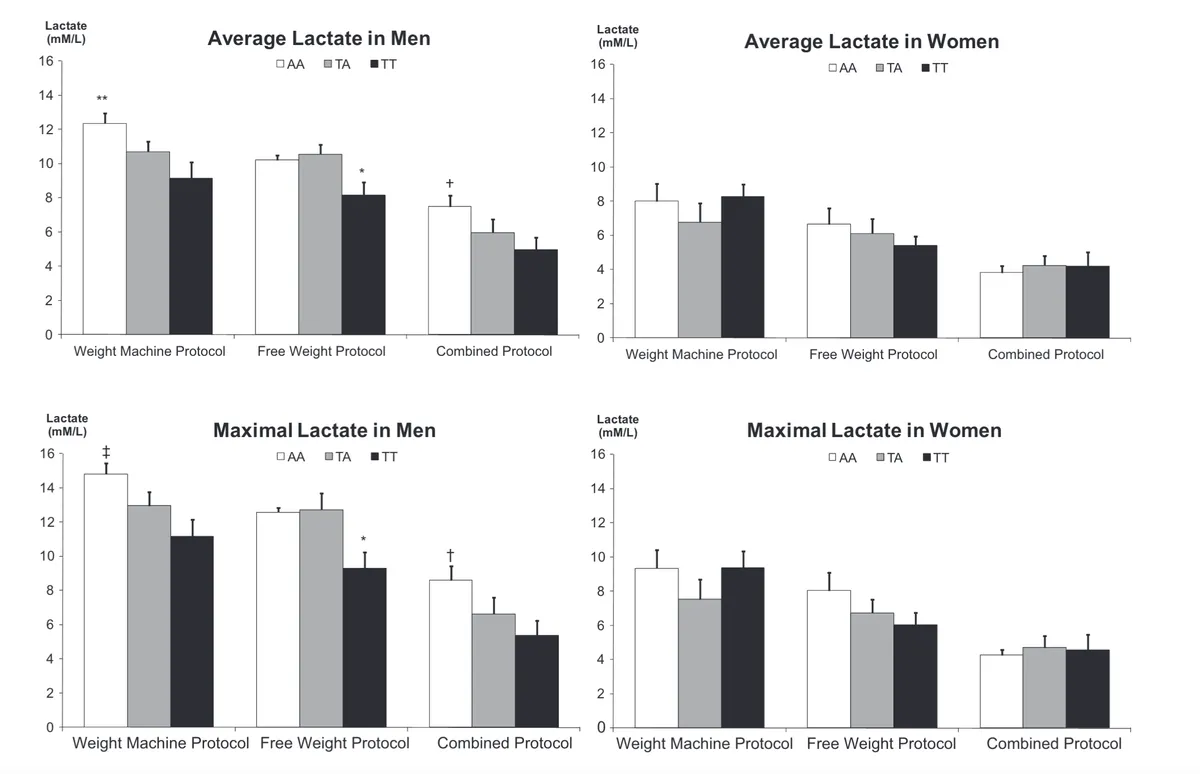
Source: Cupeiro, R., González-Lamuño, D., Amigo, T., Peinado, A. B., Ruiz, J. R., Ortega, F. B., & Benito, P. J. (2012). Influence of the MCT1-T1470A polymorphism (rs1049434) on blood lactate accumulation during different circuit weight trainings in men and women. Journal of science and medicine in sport, 15(6), 541-547.
Interestingly, the study did not find any significant differences across MCT1 genotype in women. This may be because women in this study produced less lactate during exercise (as reflected by lower blood lactate concentrations), perhaps due to lower muscle mass or differences in blood volume.
The effect of differences in lactate clearance (caused by MCT1 gene variants) would therefore have less of an impact on blood lactate levels at the lower levels of lactate production observed in women. Put more clearly, the MCT1 protein coded by the Asp (A) variant would be able to clear away and cope with lower levels of lactate released into the bloodstream. As lactate production increases, however, the MCT1 protein would then struggle to clear lactate, leading to the accumulation of lactate in the bloodstream.
On this note, an earlier 2010 study by Cupeiro and colleagues found that men carrying the Asp (A) variant of the MCT1 gene had significantly higher blood lactate levels compared to non-carriers (i.e. TT, Glu/Glu genotype) during a resistance training circuit, but only at 80% of 15RM and not at lower intensity exercise (60 and 70% of 15RM).
This is shown in the graph below. Again, these findings seem consonant with a “lactate threshold effect”, whereby the impact of reduced lactate clearance by MCT1 on blood lactate levels is only manifest during higher intensity exercise, when the production and release of lactate and hydrogen ions into bloodstream by fast-twitch, glycolytic muscle fibres is greater.
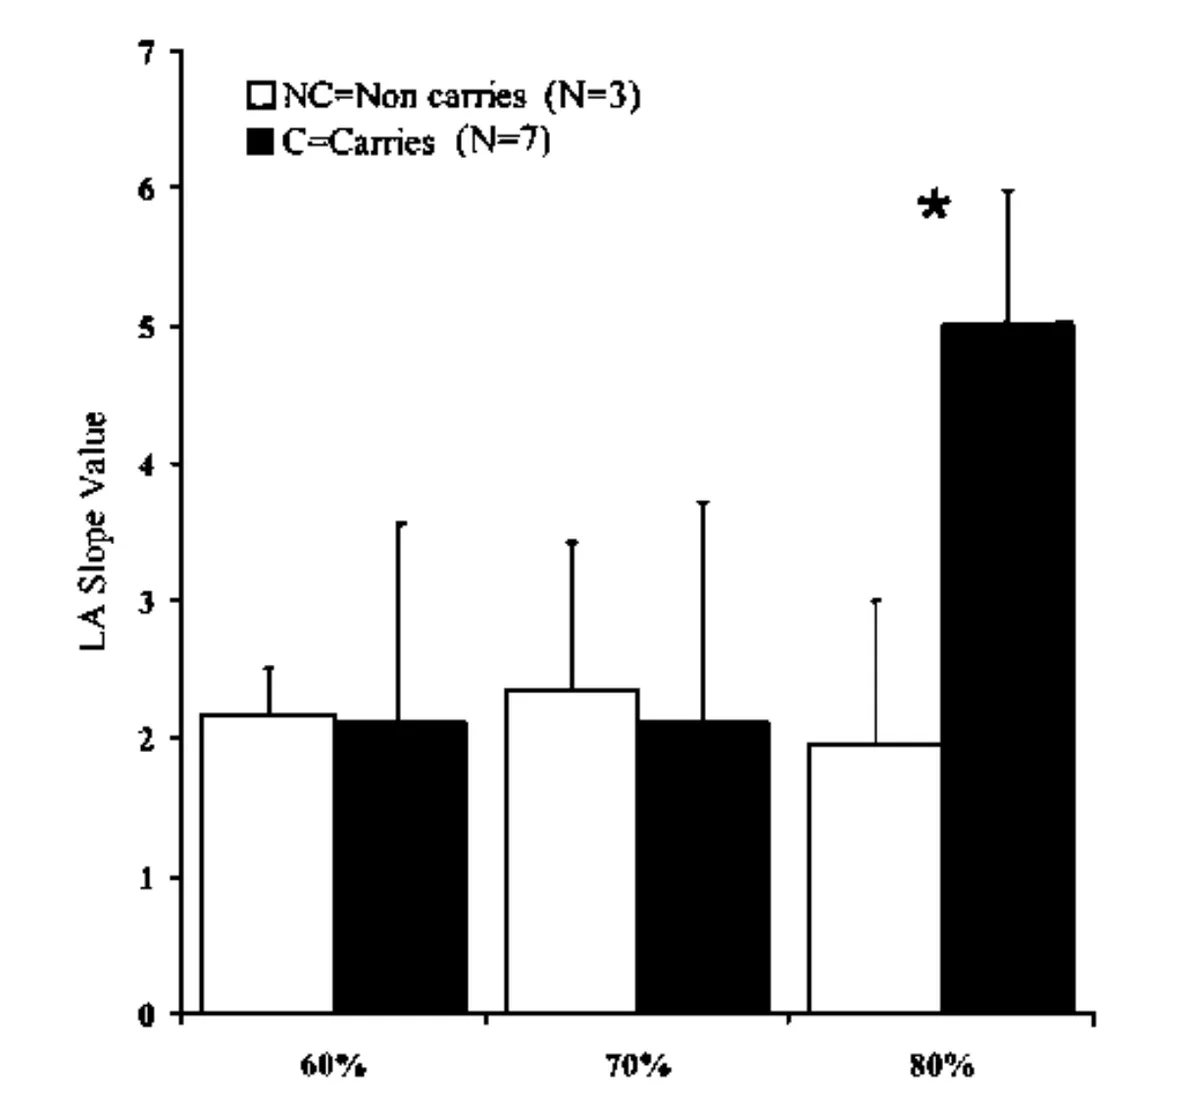
cSource: Cupeiro, R., Benito, P. J., Maffulli, N., Calderón, F. J., & González-Lamuño, D. MCTl genetic polymorphism influence in high intensity circuit training: A pilot study.
It’s important to note that the above mentioned studies have generally used very small sample sizes, making it harder to establish whether MCT1 has a true effect on lactate clearance and blood lactate levels. Furthermore, we know that exercise training has a strong effect on MCT1 expression and other physiological processes linked to lactate production and clearance; so the contribution of MCT1 gene variants alone to differences in blood lactate levels may be very small compared to training status, differences in muscle fibre composition, diet, and other lifestyle factors.
How do MCT1 gene variants affect exercise recovery?
Less effective clearance of lactate from the bloodstream may cause Asp (A) variant carriers to recover less well between exercise bouts.
Recall that the accumulation of hydrogen ions alongside lactate contributes to muscle fatigue during intense exercise. Being less able to clear away hydrogen ions (along with lactate) may therefore increase the susceptibility to muscle fatigue, as hydrogen ions more readily accumulate in the bloodstream.
One method of testing exercise recovery is to get someone to complete a series of short sprints, with each sprint punctuated by a fixed period of active recovery (e.g. jogging or walking). During the all-out sprints, lactate and hydrogen ion production by fast-twitch, glycolytic (Type IIx) muscle fibres will rapidly increase, causing a rise in blood lactate (and hydrogen ion) concentrations. During the active recovery sessions, blood lactate levels ought to then steadily decrease as lactate is cleared by MCT1 into slow-twitch muscle fibres, liver cells, and other tissues.
For someone with poorer lactate clearance, however, less hydrogen ions and lactate are removed from the bloodstream during the recovery periods. Hydrogen ions therefore start to accumulate, impairing muscle performance, with this effect being more pronounced after repeated sprints (as each recovery period is insufficient for lactate and hydrogen to be effectively removed). Consequently, we would expect the sprint times (particularly the final/later sprint times) of someone with poorer lactate clearance to deteriorate more drastically with repeated exertion.
On this note, a study of 26 elite male Italian footballers found that Asp (A) variant carriers had significantly slower mean repeated sprint times. Across a series of six sprints, those with two or one copies of the Asp (variant) ran a 30m sprint in an average of 4.61 and 4.55 seconds, respectively. This was significantly slower than the mean sprint time of 4.41 seconds in those with the Glu/Glu genotype.
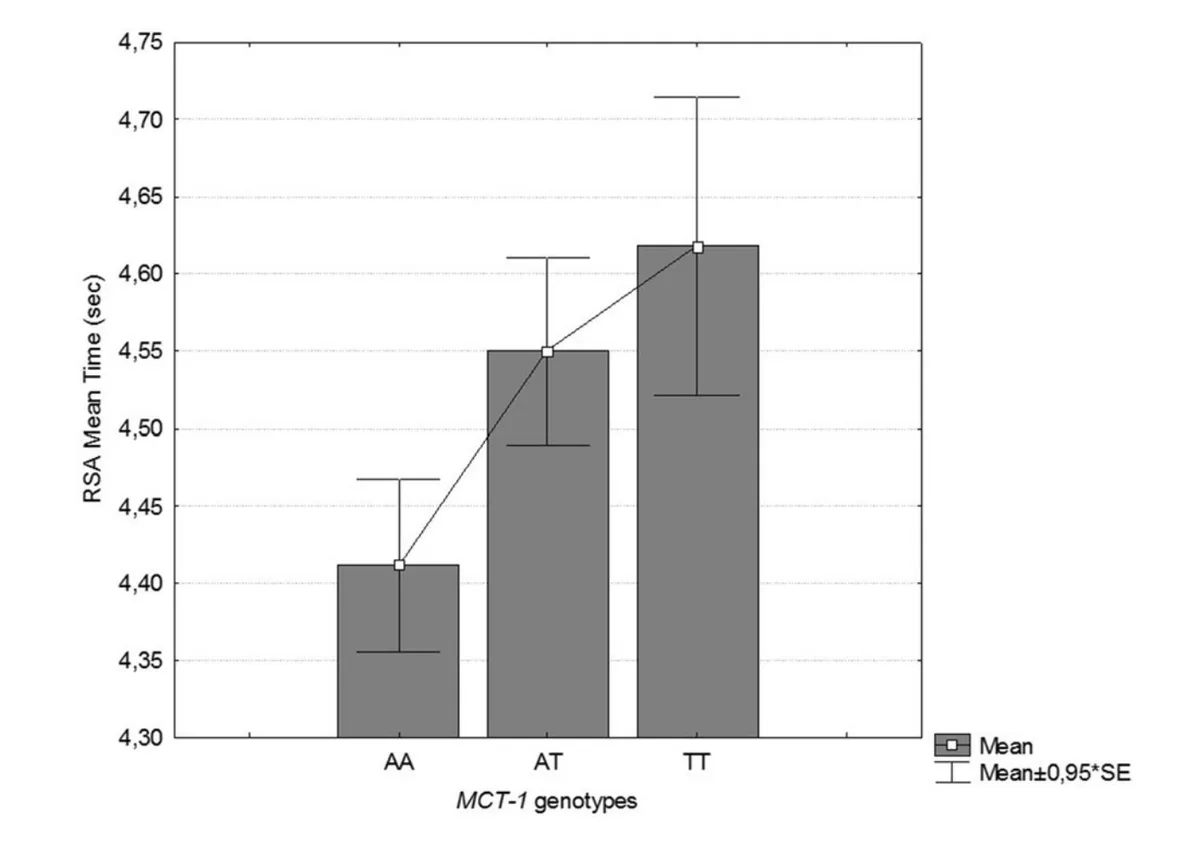
Source: Massidda, M., Flore, L., Kikuchi, N., Scorcu, M., Piras, F., Cugia, P., ... & Calò, C. M. (2021). Influence of the MCT1-T1470A polymorphism (rs1049434) on repeated sprint ability and blood lactate accumulation in elite football players: A pilot study. European Journal of Applied Physiology, 121(12), 3399-3408.
(Please note that in the above study the Asp variant is referred to as the ‘T’ allele and the Glu variant is referred to as the ‘A’ variant. This may make things confusing!).
Moreover, the fifth and sixth sprint times were significantly slower in those with two copies of the Asp variant (Asp/Asp genotype) compared to other genotypes. For the sixth sprint, those with the Asp/Asp genotype had a mean sprint time of 4.87 seconds, which was significantly slower than those carrying the Glu variant (4.56 seconds).
These results suggest that slower lactate clearance in Asp variant carriers may contribute to poorer exercise recovery and worse performance under repeated exertion. It is important to note, however, that the study did not find any statistically significant difference in blood lactate concentrations between MCT1 genotypes, although there was a trend for those with the Asp allele to have higher blood lactate levels at 1 and 3 minutes after completing all six sprints. This is illustrated in the graphs below.
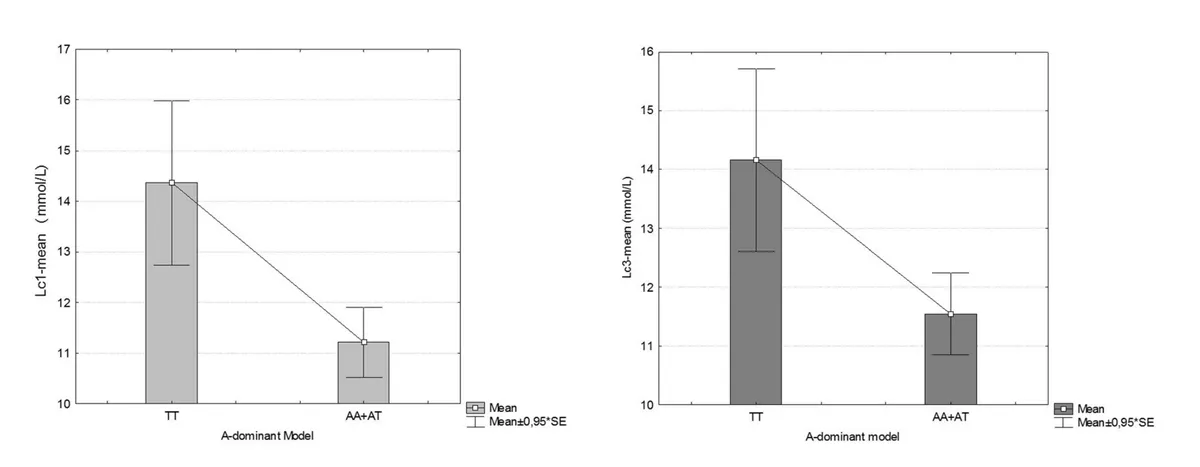
Source: Massidda, M., Flore, L., Kikuchi, N., Scorcu, M., Piras, F., Cugia, P., ... & Calò, C. M. (2021). Influence of the MCT1-T1470A polymorphism (rs1049434) on repeated sprint ability and blood lactate accumulation in elite football players: A pilot study. European Journal of Applied Physiology, 121(12), 3399-3408.
(Please note that in the above study the Asp variant is referred to as the ‘T’ allele and the Glu variant is referred to as the ‘A’ variant. This may make things confusing!).
It is possible that poorer lactate clearance in Asp (A) variant carriers also increases susceptibility to injury. The theory is that greater accumulation of hydrogen ions and lactate in the bloodstream at higher intensity exercise increases the risk of muscle fatigue, cramping and degeneration of muscle fibres, all of which can raise the risk of indirect (i.e. non-contact) muscle injury.
Researchers at the University of Cagliari examined this possibility by genotyping and following the injury rates of 173 footballers in the Serie A from 2009-2014. Footballers with the Asp/Asp (AA) genotype had an incidence of 1.57 (+/-3.07) muscle injuries per 1000 hours of game time, which was significantly higher than those with the Glu/Glu (TT) genotype (0.09 +/- 0.25 muscle injuries per 1000 hours).
How do MCT1 gene variants affect athletic status?
Some studies have found that elite (international) sprint and power athletes are more likely than non-athletes and national-level athletes to carry the Asp (A) variant.
In a 2013 study analysing the MCT1 genotypes of 112 endurance athletes, 100 sprint/power athletes, and 621 non-athlete controls, elite sprint/power athletes were found to be 1.92 times more likely than controls to carry the Asp variant compared to the Glu/Glu genotype.
This group of elite athletes, which included international 100-400m sprinters, powerlifters, weight lifters, throwers and jumpers, were also 3.40 and 2.20 times more likely than non-athletes and elite endurance athletes, respectively, to have the Asp/Asp genotype compared to the Glu/Glu genotype.
Furthermore, elite sprint/power athletes were 3.41 times more likely than national-level athletes to have the Asp/Asp genotype compared to the Glu/Glu genotype.
The authors of the study postulated that reduced lactate clearance in Asp (A) variant carriers, particularly those with two copies of the Asp variant, may, perhaps counterintuitively, be beneficial for sprint and power performance. Why may this be the case?
Recall that lactate also acts as a hormone (lactormone) or signalling molecule, and can stimulate signalling pathways (e.g. mTOR, IGF-1) that promote muscle growth and hypertrophy. The researchers speculated that higher lactate levels in the bloodstream seen in Asp (A) variant carriers (due to less effective lactate clearance) may act to stimulate muscle growth in the long-term, therefore enhancing muscle size and sprint/power performance.
While this hypothesis is worth exploring, it is also worth noting that a study of MCT1 genotypes in elite Japanese wrestlers found that while the Asp/Asp genotype was overrepresented in wrestlers compared to controls, this genotype was in fact associated with lower blood lactate levels during the 30 second Wingate-anaerobic test.